
Slowly making updates to my #StickersAndStamps project.


Slowly making updates to my #StickersAndStamps project.
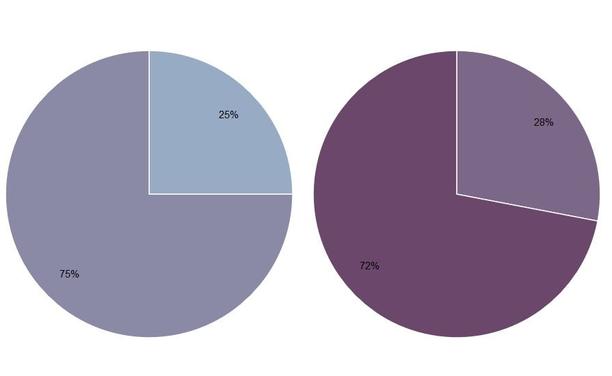
Happy Pi Day! I'm reminded of this old piece on Pie charts: "In Defense of Pie Charts, and Why You Shouldn’t Use Them"
https://medium.com/@kristinhenry/in-defense-of-pie-charts-and-why-you-shouldnt-use-them-df2e8ccb5f76
This video is a really pretty visualization of the A* pathfinding algorithm using #OpenStreetMap road network data for #Chicago and #Rome as examples.
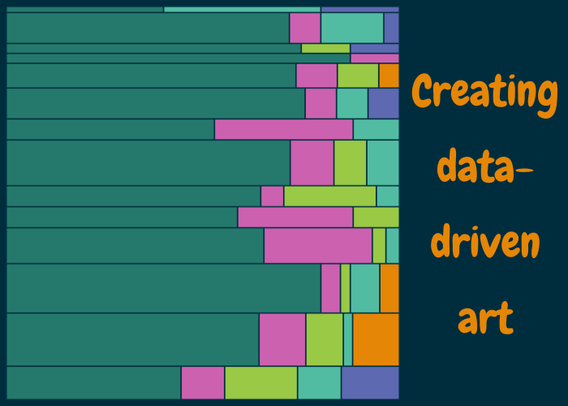
 New blog post about data art!
Have you ever wondered:
 What is data-driven art?
 Why do people make data art?
 How do I get started making my own?
Then this blog post is for you!  It includes an example using #TidyTuesday data - with code in both #Python and #RStats!
I'm super happy to see that several of my data visualisation projects were long-listed at the 2024 Information is Beautiful Awards!
Check out the full longlist here: https://www.informationisbeautifulawards.com/showcase?action=index&award=2024&controller=showcase&page=1&pcategory=long-list&type=awards


Sometimes, updating a Data Art piece is just too much of an emotional drain. And the piece must remain out of date.
But to be honest, that's part of the piece itself.
How Big is 400,000? https://kristinhenry.github.io/howBig/
I wrote a bit about the piece: https://kristinhenry.medium.com/how-big-is-400-000-922841dbc986

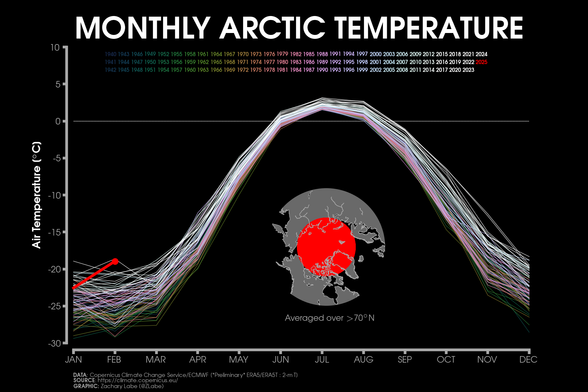
My monthly #Arctic temperature graphics have just been updated through February 2025, which was one of the most anomalous months on record for this region: https://zacklabe.com/arctic-temperatures/
I'm not really sure when @micahflee made his Hacks, Leaks, and Revelations book free to read online, but if it's been on your wish list, now's your chance to give it a read, and if you enjoy it, and can afford to, support the author.
https://hacksandleaks.com/contents.html
Buy here: https://hacksandleaks.com/
A woman's age vs. the age of the men who look best to her vs the same chart for men.
(classic #dataviz of @Okcupid data)

Por ejemplo, solicitar, compilar, homogeneizar todos los datos para hacer este mapa de presión asistencial en atención primaria nos llevó meses.
Los datos son públicos, pero no estaban abiertos. Ahora sí, porque los liberamos  https://datos.civio.es/dataset/presion-asistencial-por-profesional-de-atencion-primaria-y-por-centro-de-salud/
https://civio.es/sanidad/buscador-presion-asistencial-atencion-primaria/
I've started collecting together some of my examples of data-driven art (with accompanying code) into a gallery
Link: https://nrennie.rbind.io/data-art/
(Blog post coming soon about what I think data art is and why it's useful, alongside a tutorial-style example!)

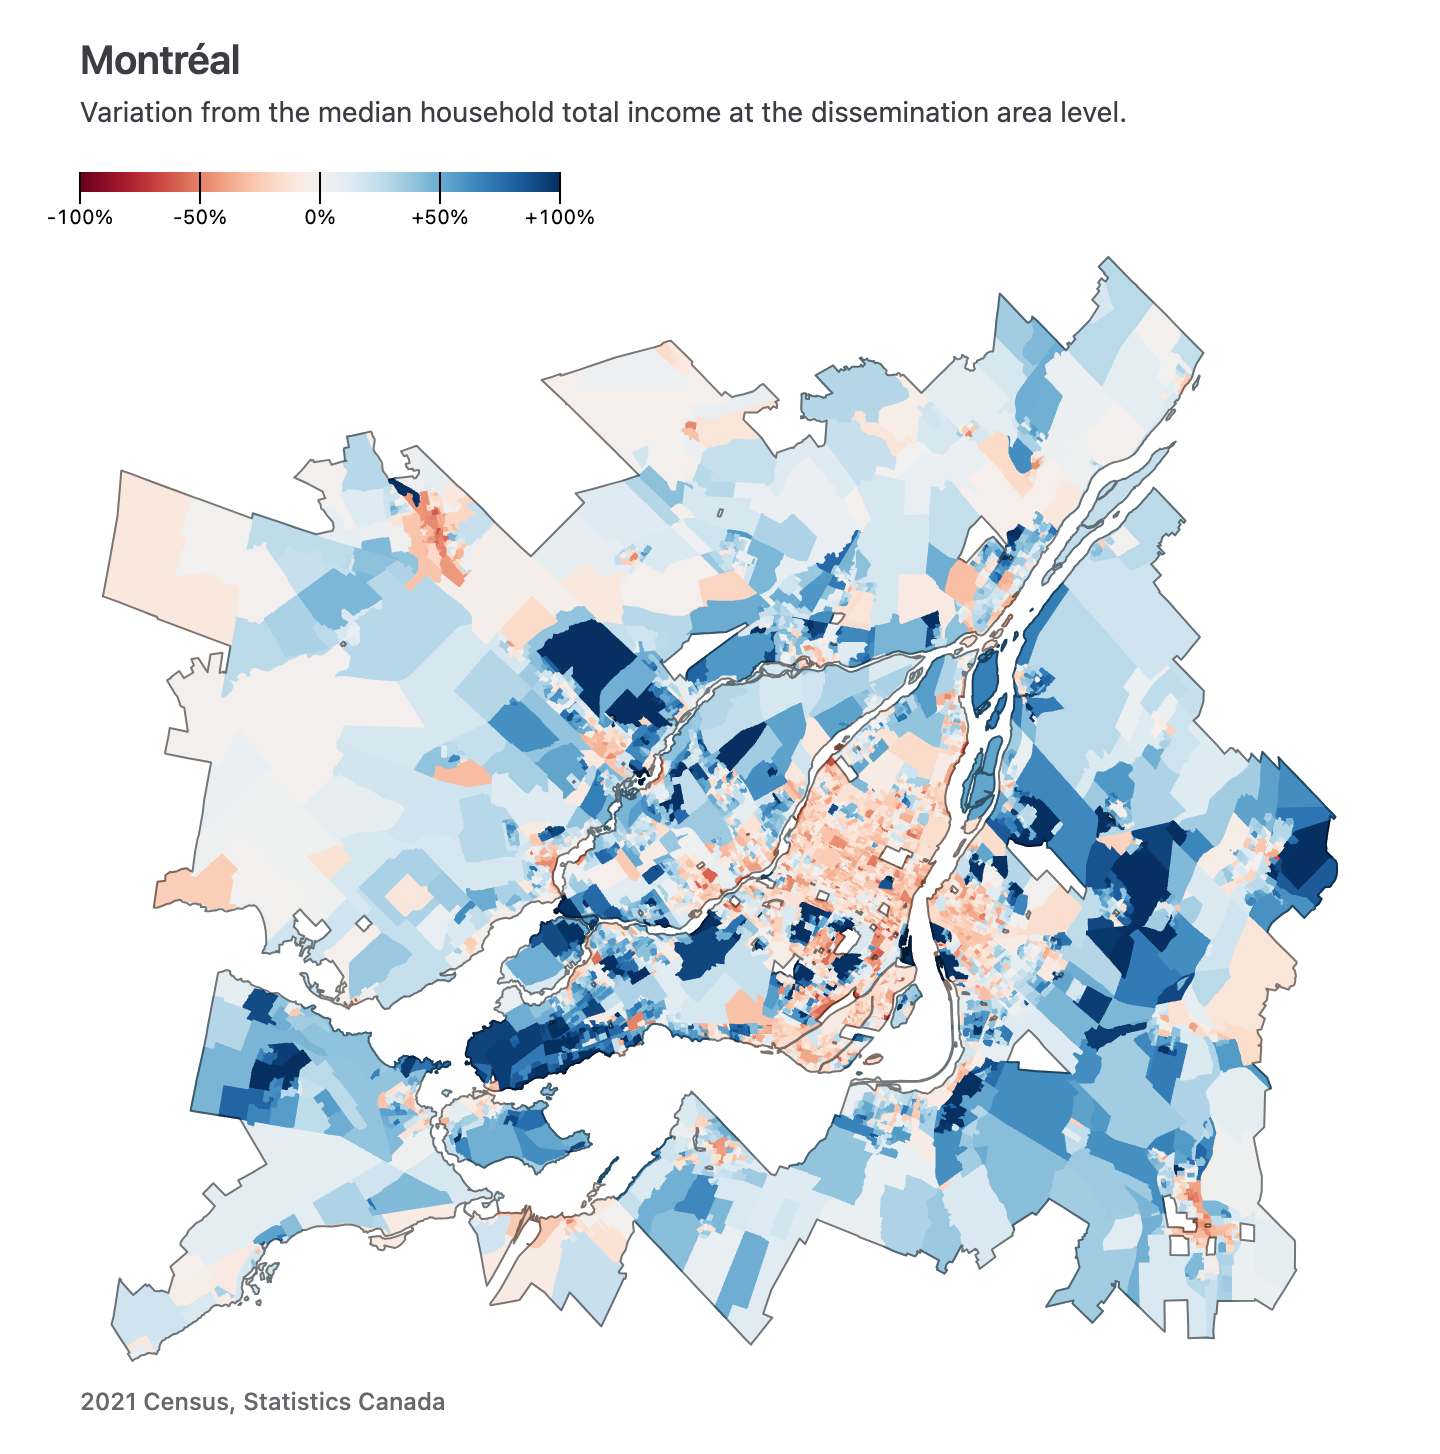
The Census is an invaluable data source, but it can be challenging to work with. In this tutorial, I’ll show you how to effortlessly slice through 30 GB of Census data using the Simple Data Analysis library in TypeScript.
As a bonus, we’ll also create maps! 
Link below 
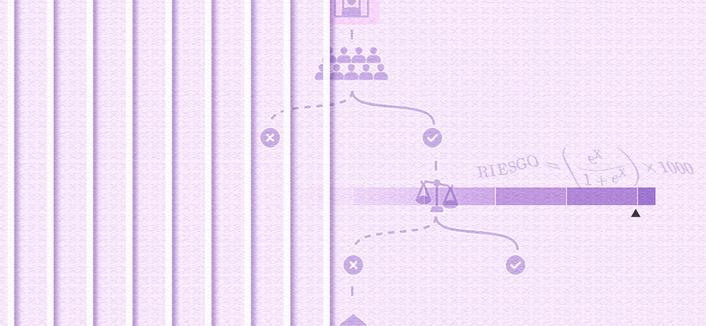
 Las prisiones españolas usan un #algoritmo sin actualizar desde 1993 para decidir sobre permisos de salida.
Más de 200 resoluciones del 2024 citan el resultado de la TVR como motivo para denegar u otorgar permisos penitenciarios.
Clasifica a los presos extranjeros sin arraigo como de riesgo elevado, aunque carezcan de otro factor de riesgo.
Te lo contamos en la nueva investigación de Ter García y @dcabo, con #dataviz de @carmen_tm y Adrián Maqueda.
How many attributes can you visualize in one chart? A little experiment on multi dimensional #dataviz that I made for a talk https://observablehq.com/@john-guerra/how-many-attributes
A set of percentage areas charts made with {geofacet} for #TidyTuesday this week! The chart explores patterns in data on which agencies report to the FBI's national reporting system.
Code: https://github.com/nrennie/tidytuesday/tree/main/2025/2025-02-18
 over time. Each small chart represents a state, with the proportion of reporting agencies increasing from 1995 to 2015. The teal areas indicate agencies that report, while the grey areas represent those that do not. Data is sourced from the FBI Crime Data API, and the visualization is created by Nicola Rennie.")
They're here! At last! The USPS Allen Toussaint stamps I ordered, are here!
If you'd like to participate in my #StickersAndStamps project, and have me use one of these stamps, mention Allen Toussaint in the question/comment in the sign up form.
How it works:
1. You sign up
2. I mail a sticker to you
3. You tell me when it arrives

In 29 states and D.C., the median income of new homeowners is now more than $100,000. We crunched the numbers on this and what these figures look like on the metro level, lots of charts and maps in this new #dataviz -driven piece for NBC News:
https://www.nbcnews.com/data-graphics/six-figure-new-homebuyers-now-normal-rcna192098

#Design #Guides
Defense against dishonest charts · How not to lie with data visualizations https://ilo.im/162ger
_____
#Charts #DataViz #Accuracy #Transparency #Content #EthicalDesign #DeceptiveDesign #ProductDesign #VisualDesign #WebDesign
What are some of your favourite science visualization, data visualization or infographics blogs?